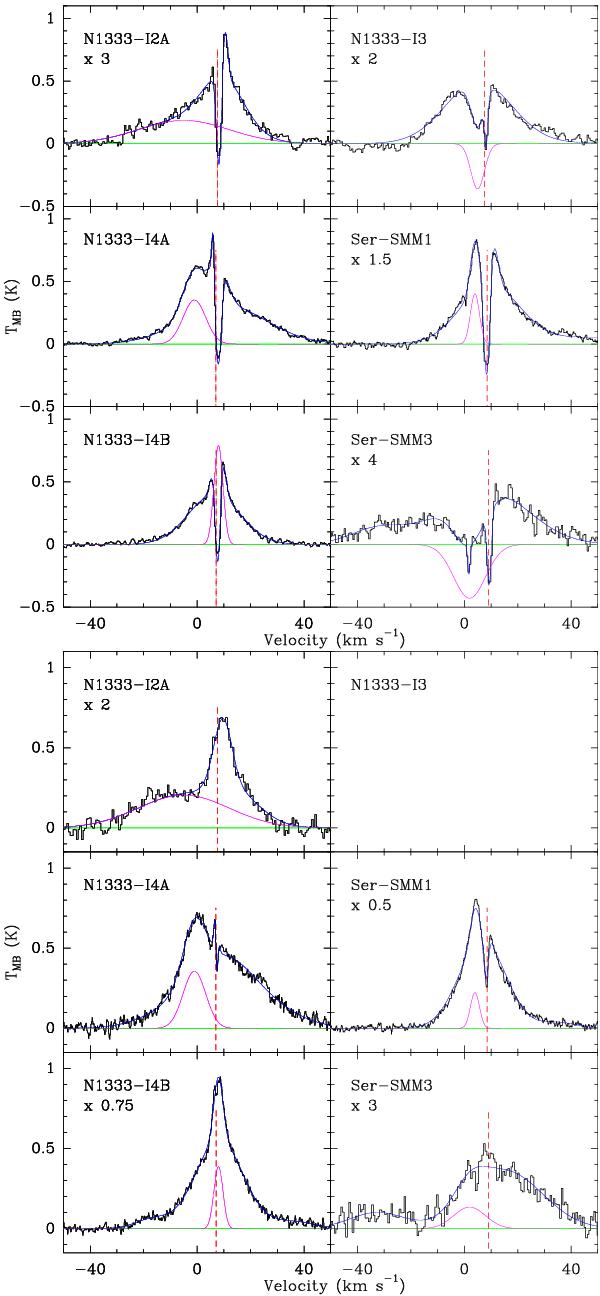
Fig. 1

Top: continuum-subtracted HIFI spectra of the H2O 110–101 ground-state transition at 557 GHz (Eup = 60 K). The profiles have been decomposed into Gaussian components and the best-fit profile is shown in blue. The offset component is highlighted in magenta for clarity. The baseline is shown in green and the source velocity with a red dashed line. Bottom: same as the top figure, except that the line shown is the excited H2O 202–111 line at 988 GHz (Eup = 100 K). More details on the decomposition are found in Kristensen et al. (2010, 2012) for the NGC1333 sources and Ser SMM3.
Current usage metrics show cumulative count of Article Views (full-text article views including HTML views, PDF and ePub downloads, according to the available data) and Abstracts Views on Vision4Press platform.
Data correspond to usage on the plateform after 2015. The current usage metrics is available 48-96 hours after online publication and is updated daily on week days.
Initial download of the metrics may take a while.


