Fig. 8
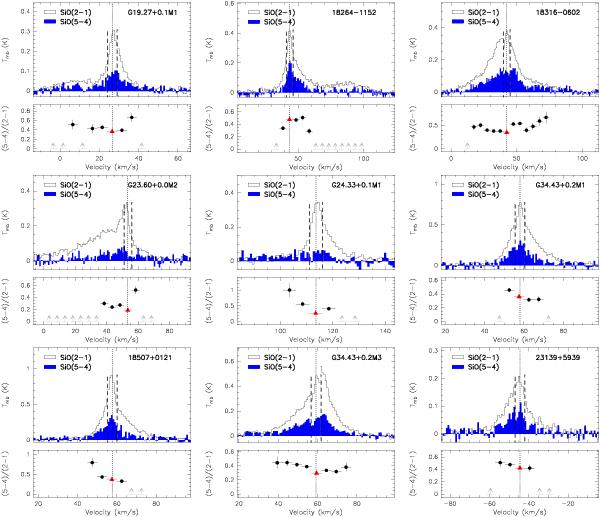
SiO (2−1) and (5−4) spectra obtained from the convolved maps. Each spectrum consists of three different parts: for blue/red-shifted velocities we have extracted the spectrum averaged over the area defined by the 50% contour level of the blue/red-shifted integrated emission (considering the velocity intervals listed in Table 3), and for systemic velocities the area is defined by the 50% contour level of the whole integrated emission. The vertical dashed lines indicate the three distinct velocity regimes, and the dotted vertical line corresponds to the systemic velocity. In the bottom panels (below each spectrum) we plot the (5−4)/(2−1) line ratio for velocity intervals of 5 km s-1 width. Red triangles correspond to the line ratio at the systemic velocity.
Current usage metrics show cumulative count of Article Views (full-text article views including HTML views, PDF and ePub downloads, according to the available data) and Abstracts Views on Vision4Press platform.
Data correspond to usage on the plateform after 2015. The current usage metrics is available 48-96 hours after online publication and is updated daily on week days.
Initial download of the metrics may take a while.