Fig. 5
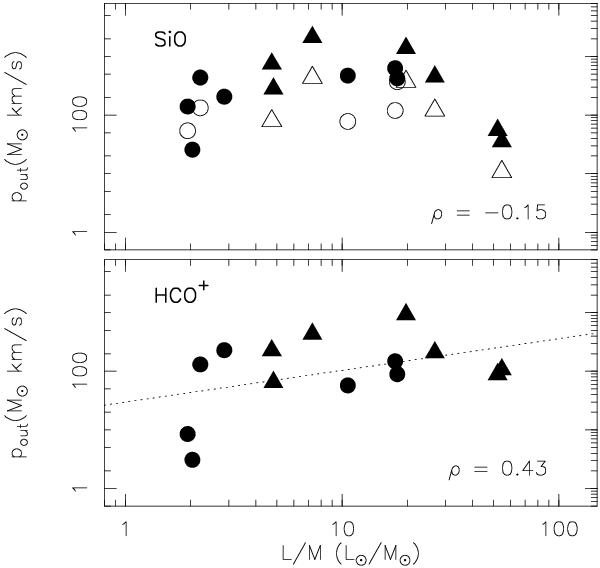
Outflow momentum against L/M, for the SiO (2−1) and HCO+ (1−0) outflows. Data for SiO (5−4) outflows are indicated as open symbols. Triangles and circles correspond to sources classified as IRL and IRD, respectively (see Table 1). The black dotted line shows the result of a least squares fit to the data, with the Pearson correlation coefficient (ρ) shown in the bottom right corner.
Current usage metrics show cumulative count of Article Views (full-text article views including HTML views, PDF and ePub downloads, according to the available data) and Abstracts Views on Vision4Press platform.
Data correspond to usage on the plateform after 2015. The current usage metrics is available 48-96 hours after online publication and is updated daily on week days.
Initial download of the metrics may take a while.