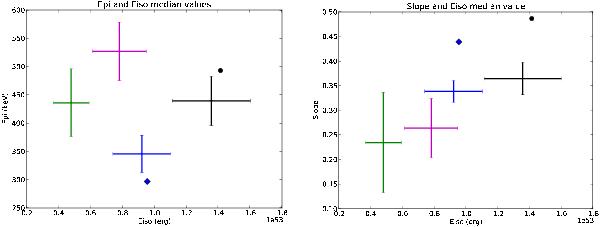
Fig. 4

Comparison of simulated GRB populations. Left panel. Epi as a function of Eiso. Right panel. Slope of the Epi – Eiso relation as a function of Eiso. Green: Fermi GRBs with no redshift not localized by Swift/BAT; purple: Fermi GRBs with no redshift localized by Swift/BAT; blue: Fermi GRBs with a redshift localized by Swift/BAT; black: Fermi GRBs with a redshift, irrespective of the satellite used for the localization. The crosses show the median values and the corresponding error, measured from 1000 simulated samples. The point symbols show the values measured for two actual samples: in blue 34 GRBs studied in Sect. 5.2, and in black the full sample of 43 GRBs with a redshift.
Current usage metrics show cumulative count of Article Views (full-text article views including HTML views, PDF and ePub downloads, according to the available data) and Abstracts Views on Vision4Press platform.
Data correspond to usage on the plateform after 2015. The current usage metrics is available 48-96 hours after online publication and is updated daily on week days.
Initial download of the metrics may take a while.


