Fig. 6
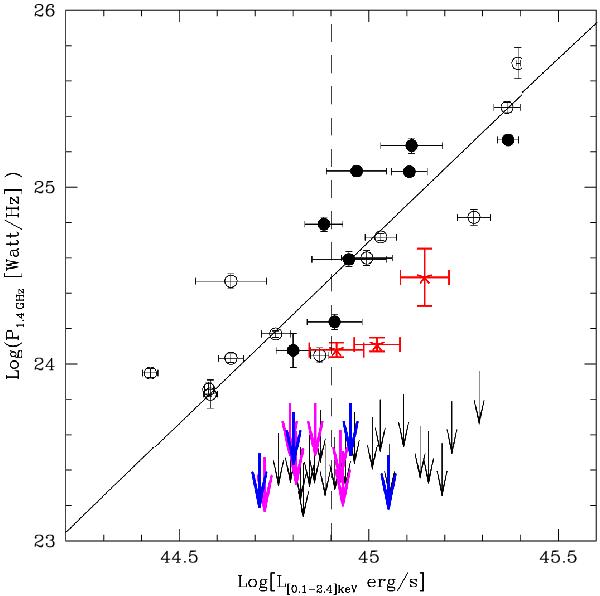
The new upper limits (magenta and blue arrows) are shown in the P1.4 GHz − LX plane with the correlation line (black solid line) for giant radio halos reproduced from Brunetti et al. (2009). The magenta arrows are EGRHS clusters, and the blue arrows are GRHS clusters presented here (see Table 1). The giant radio halos that are hosted in the clusters in the EGRHS+GRHS sample are denoted by filled black circles and red asterisks (USSRHs). The other giant radio halos (black open circles) and upper limits (black arrows) are reproduced from Brunetti et al. (2009). The vertical dashed line shows the division between low- and high-luminosity bins.
Current usage metrics show cumulative count of Article Views (full-text article views including HTML views, PDF and ePub downloads, according to the available data) and Abstracts Views on Vision4Press platform.
Data correspond to usage on the plateform after 2015. The current usage metrics is available 48-96 hours after online publication and is updated daily on week days.
Initial download of the metrics may take a while.