Fig. 1
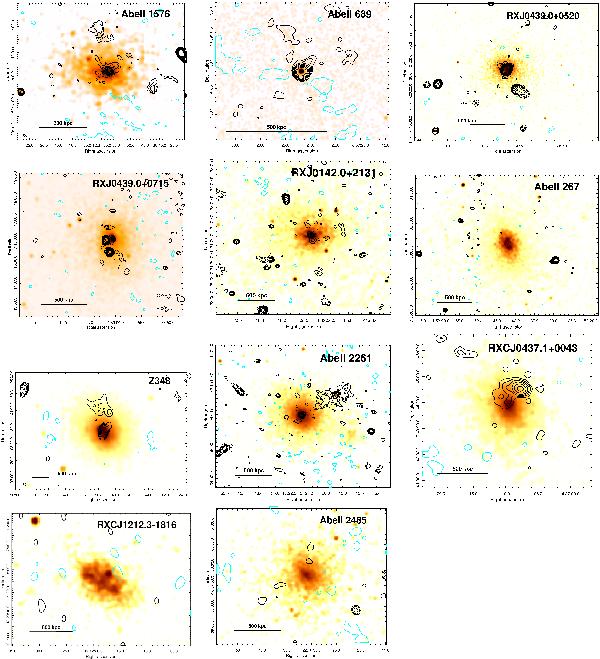
Radio images (contours) are shown overlaid on X-ray images (colour) for the 11 galaxy clusters presented in this paper. The radio images are at 610 MHz for the clusters A1576, A689, RX J0439.0+0520, RX J0439.0+0715, RX J0142.0+2131, A267, Z348, and A2261 and at 325 MHz for the clusters RXC J0437.1+0043, RXC J1212.3-1816, and A2485. The contour levels are at 3σ × (± 1,2,4,8,...) (see Table 2 for 1σ levels and the beam sizes). Positive contours are shown in black and negative in cyan. The exposure-corrected Chandra (ACIS-I) images are presented for all clusters, except RXC J1212.3-1816, for which an XMM-Newton (EPIC MOS) pipeline processed image is presented. The X-ray images are smoothed to resolutions of 10′′−15′′.
Current usage metrics show cumulative count of Article Views (full-text article views including HTML views, PDF and ePub downloads, according to the available data) and Abstracts Views on Vision4Press platform.
Data correspond to usage on the plateform after 2015. The current usage metrics is available 48-96 hours after online publication and is updated daily on week days.
Initial download of the metrics may take a while.