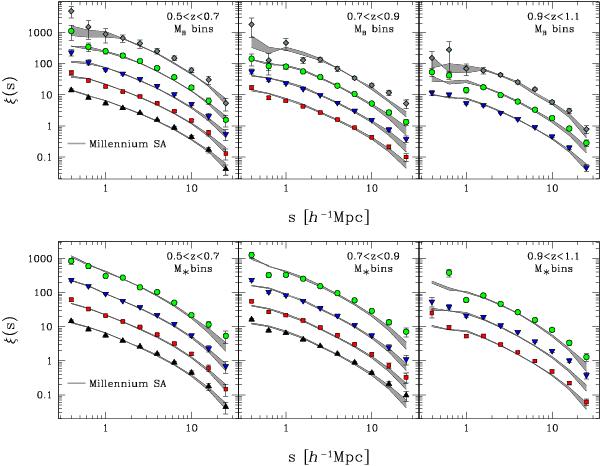
Fig. 8

Redshift-space 2PCF of VIPERS galaxies compared to theoretical expectations as a function of B-band magnitude (upper panels) and stellar mass (bottom panels). The coloured symbols used for VIPERS measurements are the same as in Fig. 3. The grey shaded areas show the 2PCF measured in two large galaxy mock catalogues, constructed with the Munich semi-analytic model. The 2PCFs in different sub-samples are offset by 0.5 dex, starting from the lower luminosity and stellar mass samples, for visual clarity.
Current usage metrics show cumulative count of Article Views (full-text article views including HTML views, PDF and ePub downloads, according to the available data) and Abstracts Views on Vision4Press platform.
Data correspond to usage on the plateform after 2015. The current usage metrics is available 48-96 hours after online publication and is updated daily on week days.
Initial download of the metrics may take a while.


