Fig. 5
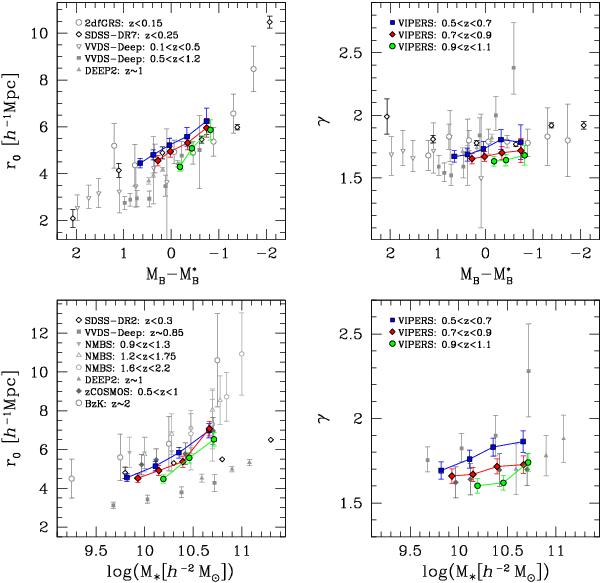
Best-fit values of the correlation length, r0, (left panels) and slope, γ, (right panels), as a function of B-band absolute magnitude (upper panels) and stellar mass (bottom panels). VIPERS costraints, obtained in threshold samples at z ∈ [0.5,0.7], z ∈ [0.7,0.9], and z ∈ [0.9,1.1] are shown, respectively, by blue squares, red diamonds, and green circles, as indicated by the labels. The remaining grey symbols refer to measurements based on data from other surveys, reported here for comparison: upper panels – DSS-DR7 data from Zehavi et al. (2011), 2dfGRS data from Norberg et al. (2002), VVDS-Deep data from Pollo et al. (2006) and DEEP2 data from Coil et al. (2006); lower panels – SDSS-DR2 data from Li et al. (2006), VVDS-Deep data from Meneux et al. (2008), zCOSMOS data from Meneux et al. (2009), NMBS data from Wake et al. (2011), DEEP2 data from Mostek et al. (2013) and BzK data from Lin et al. (2012).
Current usage metrics show cumulative count of Article Views (full-text article views including HTML views, PDF and ePub downloads, according to the available data) and Abstracts Views on Vision4Press platform.
Data correspond to usage on the plateform after 2015. The current usage metrics is available 48-96 hours after online publication and is updated daily on week days.
Initial download of the metrics may take a while.