Fig. 2
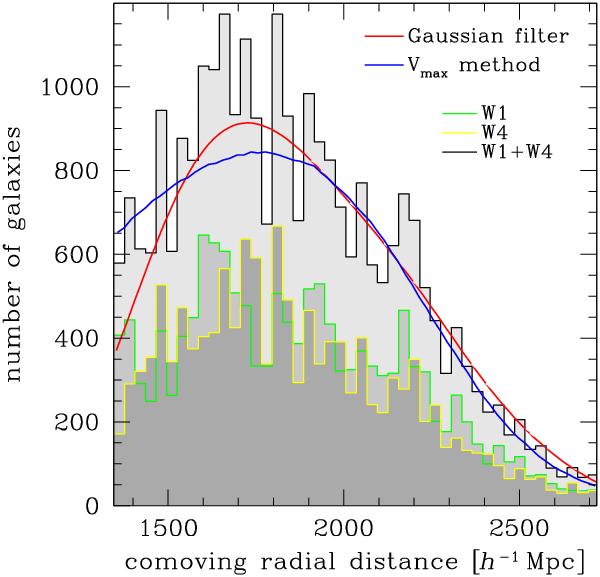
Comoving radial distance distribution of the W1 and W4 VIPERS galaxy samples, shown with the green and yellow histograms, respectively. The red and blue lines show the total W1+W4 smoothed distribution, obtained by filtering the observed distribution with a Gaussian kernel of σ = 150 h-1 Mpc and using the Vmax method, respectively.
Current usage metrics show cumulative count of Article Views (full-text article views including HTML views, PDF and ePub downloads, according to the available data) and Abstracts Views on Vision4Press platform.
Data correspond to usage on the plateform after 2015. The current usage metrics is available 48-96 hours after online publication and is updated daily on week days.
Initial download of the metrics may take a while.