Fig. 4
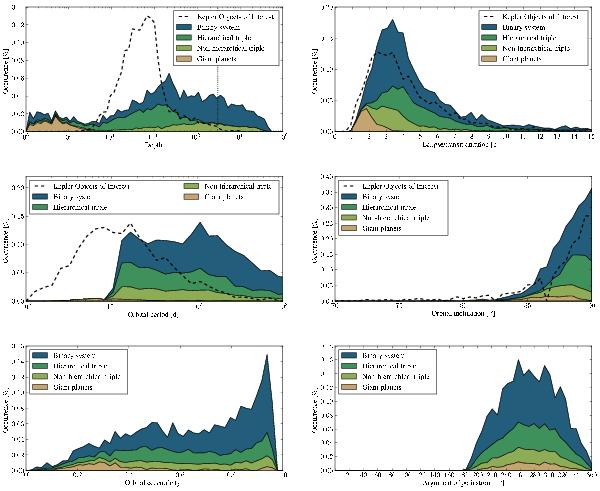
Stacked distributions (magnified by 30) of the secondary-only EB and occulting-only giant planets for their eclipse/transit depth (upper-left plot), eclipse/transit duration (upper-right plot), orbital period (middle-left plot), inclination (middle-right plot), eccentricity (lower-left plot), and argument of periastron (lower-right plot). The distribution have been normalized to represent the relative occurrence as computed in Table 1. Corresponding distributions of Kepler objects of interest (from Batalha et al. 2012, dashed black line) are also displayed, when known. The vertical dotted line in the upper-left plot represent the commonly-used 3% upper limit in depth of planetary transit candidates.
Current usage metrics show cumulative count of Article Views (full-text article views including HTML views, PDF and ePub downloads, according to the available data) and Abstracts Views on Vision4Press platform.
Data correspond to usage on the plateform after 2015. The current usage metrics is available 48-96 hours after online publication and is updated daily on week days.
Initial download of the metrics may take a while.