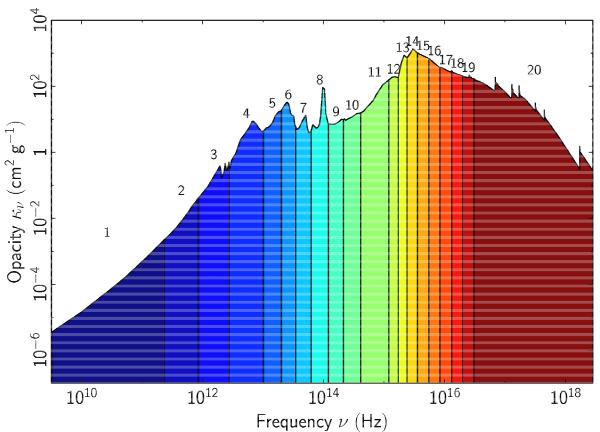
Fig. 5

Decomposition of the frequency domain using 20 groups, presented over the monochromatic dust opacities. The first and last groups are used to make sure no energy is omitted at the low and high ends of the spectrum, respectively. The other groups offer an almost log-regular splitting of frequencies in the range 2.0 × 10¹¹−3 × 10¹⁶ Hz. The group numbers are indicated just above the opacity curve. The presented spectral opacities are for typical initial conditions of ρ = 10-18 g cm-3 and T = 10 K.
Current usage metrics show cumulative count of Article Views (full-text article views including HTML views, PDF and ePub downloads, according to the available data) and Abstracts Views on Vision4Press platform.
Data correspond to usage on the plateform after 2015. The current usage metrics is available 48-96 hours after online publication and is updated daily on week days.
Initial download of the metrics may take a while.


