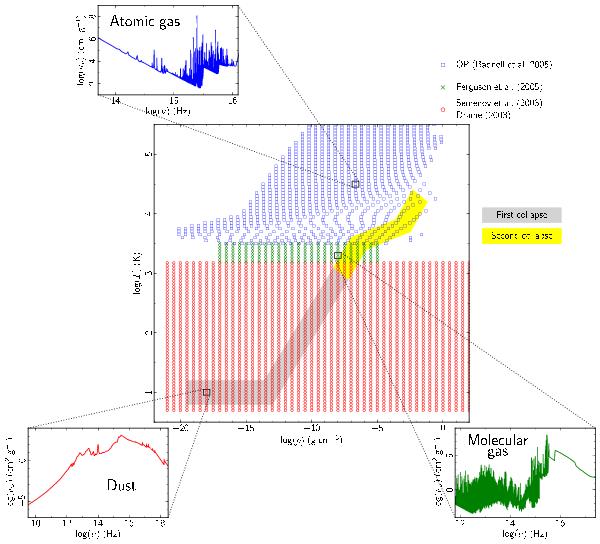
Fig. 2

Spectral opacities κ(ρ,T,ν). Each data point represents a set of spectral opacities for a given density and temperature. The table has been compiled from three different opacity collections. At low temperatures (below 1500 K), the dust opacities are from Semenov et al. (2003) and are completed by the dust grains opacities of Draine (2003b) at the high frequency end (red circles). For temperatures between 1500 and 3200 K, the opacities for molecular gas based on the Ferguson et al. (2005) calculations are used (green crosses). Finally, for temperatures above 3200 K, the atomic gas opacities are from the OP project (Badnell et al. 2005, blue squares). Two coloured areas, grey and yellow, show the approximate range of densities and temperatures typically reached during the first and second stages of the collapse of a cloud core, respectively.
Current usage metrics show cumulative count of Article Views (full-text article views including HTML views, PDF and ePub downloads, according to the available data) and Abstracts Views on Vision4Press platform.
Data correspond to usage on the plateform after 2015. The current usage metrics is available 48-96 hours after online publication and is updated daily on week days.
Initial download of the metrics may take a while.


