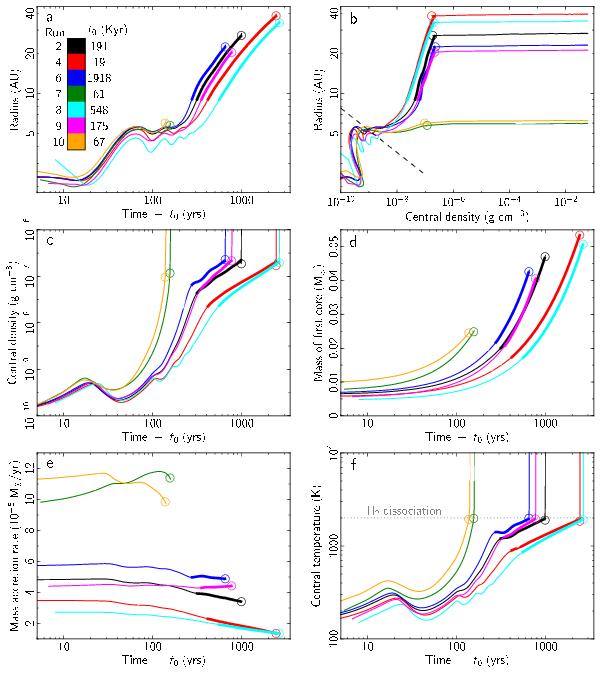
Fig. 11

Evolution of the first core for runs 2, 4, 6, 7, 8, 9, and 10 (see colour legend in top-left panel). (a) Core radius as a function of time. (b) Core radius as a function of central density. The dashed line represents the Masunaga et al. (1998) estimate. (c) Central density as a function of time. (d) First core mass as a function of time. (e) Mass accretion rate at the core border as a function of time. (f) Central temperature as a function of time. t0 represents the time when ρc ≥ 10-10 g cm-3, taken as the time of first core formation; t0 is listed for each run next to the colour key in panel (a). In all panels, the circles mark the onset of the second collapse and the bold lines trace the transition region when the central density and temperature increase more slowly than during the rest of the simulation (see text).
Current usage metrics show cumulative count of Article Views (full-text article views including HTML views, PDF and ePub downloads, according to the available data) and Abstracts Views on Vision4Press platform.
Data correspond to usage on the plateform after 2015. The current usage metrics is available 48-96 hours after online publication and is updated daily on week days.
Initial download of the metrics may take a while.


