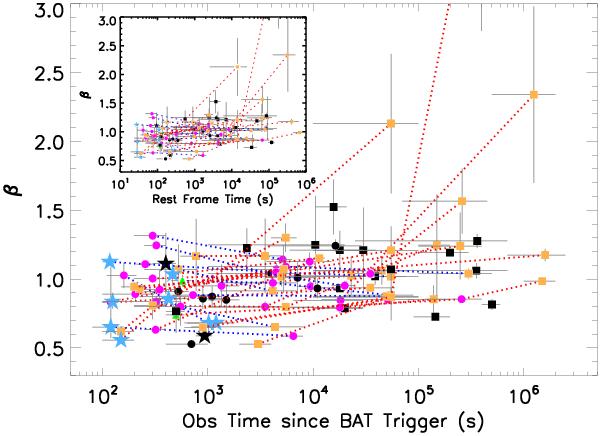
Fig. 4

Evolution of β with time for individual GRBs. For every GRB we considered the “correct” spectral index as selected in Table C.8, hence β can be βop,X or βX depending on the chosen SED fitting function, a single power-law or a broken power-law. Blue dotted lines: the initial spectral slope is steeper than the final spectral slope. Red dotted lines: the initial spectral slope is flatter than the final spectral slope. Light blue stars: steep decay data. Magenta dots: plateau data. Orange squares: normal decay data. Black: only one SED is available for these GRBs and precisely during the steep decay (stars), the plateau (dots), and normal decay (squares). Inset: the same as the principal plot, but in the rest frame.
Current usage metrics show cumulative count of Article Views (full-text article views including HTML views, PDF and ePub downloads, according to the available data) and Abstracts Views on Vision4Press platform.
Data correspond to usage on the plateform after 2015. The current usage metrics is available 48-96 hours after online publication and is updated daily on week days.
Initial download of the metrics may take a while.


