Fig. 10
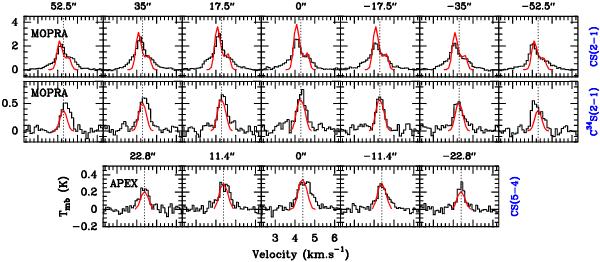
Best fit model “MCS” for the CS and C34S molecular transitions. The black lines represent the observed spectra, while the red spectra are generated by the MAPYSO radiative transfer code. The dotted line shows the systemic velocity of Cha-MMS1 derived from a seven-component hyperfine fit to the N2H+ 1−0 multiplet. For the APEX spectra, a correction of 0.1 km s-1 was added (see Sect. 3.2.1). The angular separation of the different positions with respect to the central spectrum is shown on top of the respective spectra. The model assumes spherical symmetry, so the model spectra at symmetric positions are identical. The telescope used for conducting the obervations is shown at the leftmost box of each row. The spectra from left to right correspond to the south-east to north-west direction perpendicular to the filament.
Current usage metrics show cumulative count of Article Views (full-text article views including HTML views, PDF and ePub downloads, according to the available data) and Abstracts Views on Vision4Press platform.
Data correspond to usage on the plateform after 2015. The current usage metrics is available 48-96 hours after online publication and is updated daily on week days.
Initial download of the metrics may take a while.