Fig. 9
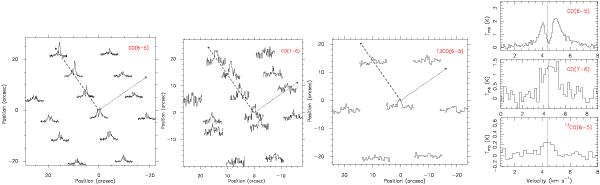
CO 6−5, CO 7−6, and 13CO 6−5 spectra observed with the APEX telescope. The central position of Cha-MMS1 is at (0,0). The directions parallel and perpendicular to the filament are shown as dashed and dotted arrows, respectively. The central spectra of the three transitions are plotted in the rightmost panel on the scale of the main-beam brightness temperature. The dotted line shows the systemic velocity of Cha-MMS1 derived from a seven-component hyperfine fit to the N2H+ 1−0 multiplet and corrected for the 0.1 km s-1 velocity shift (see Sect. 3.2.1).
Current usage metrics show cumulative count of Article Views (full-text article views including HTML views, PDF and ePub downloads, according to the available data) and Abstracts Views on Vision4Press platform.
Data correspond to usage on the plateform after 2015. The current usage metrics is available 48-96 hours after online publication and is updated daily on week days.
Initial download of the metrics may take a while.