Fig. 4
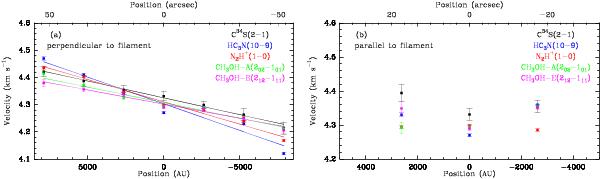
Position–velocity diagrams of the Mopra C34S 2−1 (black), HC3N 10−9 (blue), N2H+ 1−0 (red), CH3OH−A 20,2−10,1 (green), and CH3OH−E 21,2−11,1 (pink) transitions, a) perpendicular and b) parallel to the filament. The error bars represent standard deviations (1σ). Linear fits to the velocities for each transition are shown with the same colour as in panel a).
Current usage metrics show cumulative count of Article Views (full-text article views including HTML views, PDF and ePub downloads, according to the available data) and Abstracts Views on Vision4Press platform.
Data correspond to usage on the plateform after 2015. The current usage metrics is available 48-96 hours after online publication and is updated daily on week days.
Initial download of the metrics may take a while.