Fig. 21
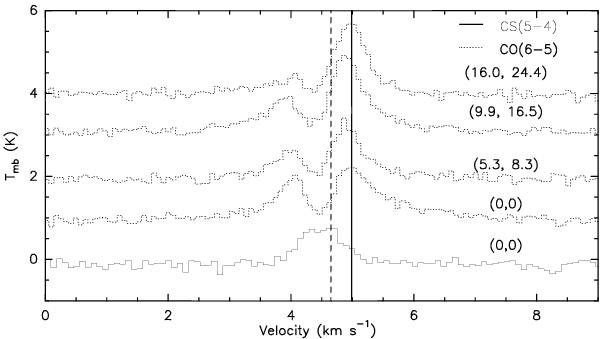
Comparison of the CS 5−4 spectrum (solid) toward the central position of Cha-MMS1 and CO 6−5 spectra (dotted) taken at the central position and in the north-east direction toward the nearby Class I protostar. The offset position of each spectrum is given in arcseconds relative to the central position. The CO 6−5 spectra are shifted vertically by a step of 1 K for clarity. The solid vertical line roughly corresponds to the velocity of the CO 6−5 red peak, while the dashed line marks the velocity of the peak of the CS 5−4 excess emission.
Current usage metrics show cumulative count of Article Views (full-text article views including HTML views, PDF and ePub downloads, according to the available data) and Abstracts Views on Vision4Press platform.
Data correspond to usage on the plateform after 2015. The current usage metrics is available 48-96 hours after online publication and is updated daily on week days.
Initial download of the metrics may take a while.