Fig.9
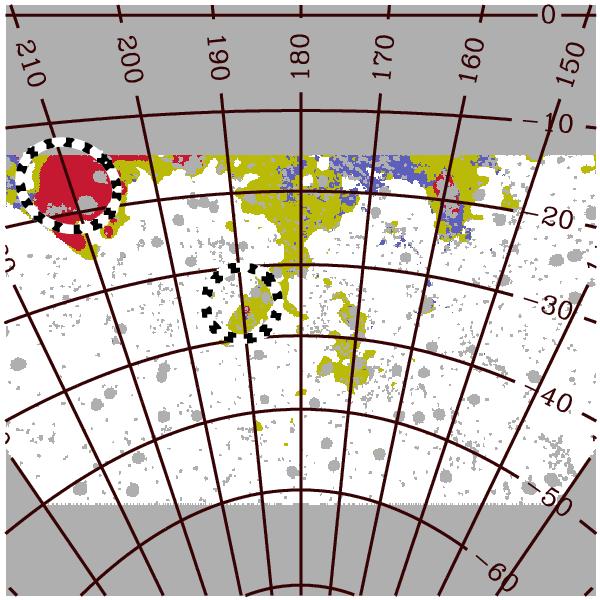
Partitioning of the Gould Belt region based on thresholds over free-free emission (red), CO emission (blue), and total emission at 30 GHz (yellow), used as tracers of Hii gas, molecular gas, and diffuse ISM environments, respectively, and the rest of the Gould Belt region (white). Circled regions are those selected for computing the spectra and have been labelled Hii-gas (Barnard’s arc) and diffuse ISM (centred on l = 190°, b = −35°) regions, respectively.
Current usage metrics show cumulative count of Article Views (full-text article views including HTML views, PDF and ePub downloads, according to the available data) and Abstracts Views on Vision4Press platform.
Data correspond to usage on the plateform after 2015. The current usage metrics is available 48-96 hours after online publication and is updated daily on week days.
Initial download of the metrics may take a while.