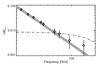
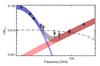
Fig.8

Comparison between correlation coefficients (symbols with error bars) and component separation results (shaded areas) for free-free emission (top) and dust emission (bottom). For free-free emission we show the Dickinson et al. (2003) Hα correlation coefficients and for dust emission the Finkbeiner et al. (1999) correlation coefficients. The grey area in the bottom panel is the sum of the AME (blue) and thermal dust (red) components. The dash-dotted line in both panels shows the 1σ error due to the chance correlation of CMB with foreground templates, estimated using simulations.
Current usage metrics show cumulative count of Article Views (full-text article views including HTML views, PDF and ePub downloads, according to the available data) and Abstracts Views on Vision4Press platform.
Data correspond to usage on the plateform after 2015. The current usage metrics is available 48-96 hours after online publication and is updated daily on week days.
Initial download of the metrics may take a while.