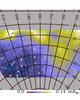
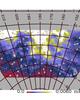
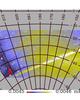
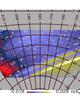
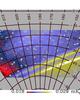
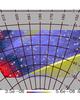
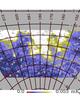
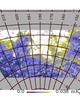
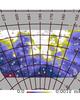
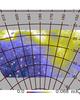
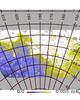
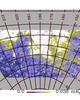
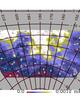
Fig.4
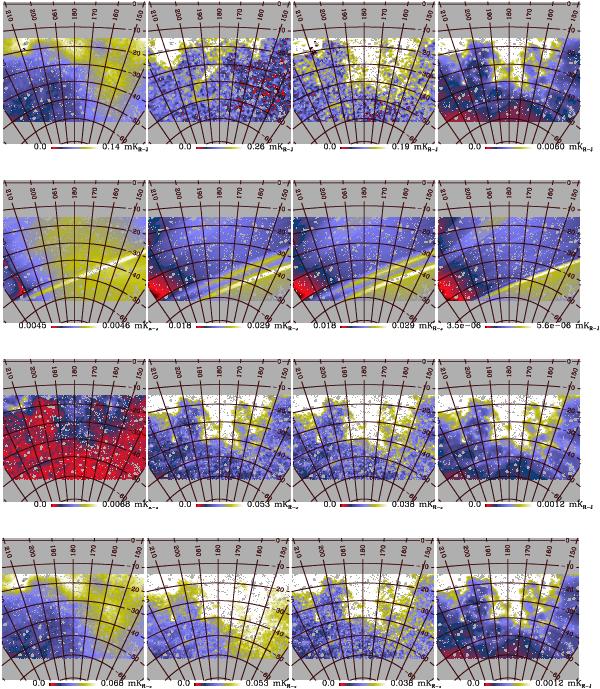
1° resolution reconstruction at 30 GHz of (from left to right): synchrotron emission; free-free emission; AME; and thermal dust emission. These reconstructions are performed as described in Sect. 3.3.2. Rows from top to bottom: component amplitudes; noise rms; predicted rms of component separation error due to the estimation of AME and thermal dust spectra; and predicted rms of component separation error including a random error on βs = −2.9 ± 0.1.

Current usage metrics show cumulative count of Article Views (full-text article views including HTML views, PDF and ePub downloads, according to the available data) and Abstracts Views on Vision4Press platform.
Data correspond to usage on the plateform after 2015. The current usage metrics is available 48-96 hours after online publication and is updated daily on week days.
Initial download of the metrics may take a while.