Fig.3
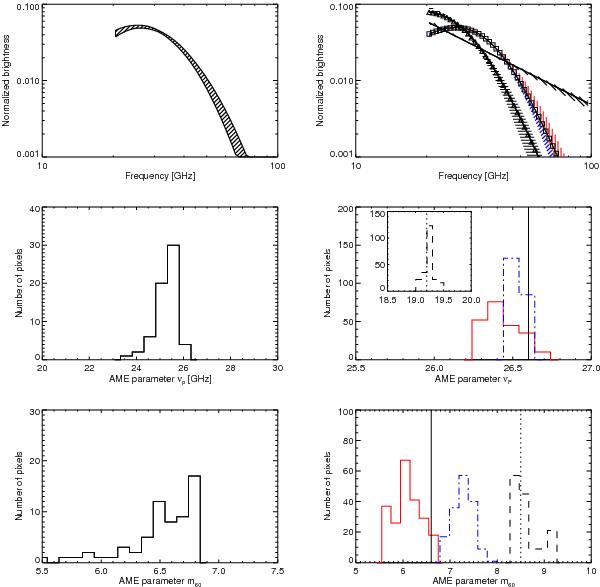
CCA estimates of the AME frequency spectrum in the region of interest for real data (left panels) and simulated data (right panels). Top: estimated spectra including 1σ errors. Middle and bottom: histograms of the spectral parameters m60 and νp on Nside = 16 estimated spectral index maps. For the simulated case (right panels) we considered two convex spectra peaking at 19 GHz and 26 GHz and a power-law model. Top right: the true inputs are shown as solid black lines (power-law) with triangles (19 GHz peak) and squares (26 GHz peak) and the estimates as shaded areas. The blue and red colours show estimates derived by exploiting the free-free templates FF1 and FF2 described in Appendix C. Middle and bottom-right panels: the true inputs are shown as solid and dotted vertical lines for the simulations peaking at 26 GHz and 19 GHz respectively; the blue dot-dashed and red solid histograms show the estimates obtained using the FF1 and FF2 templates, and the black dashed lines show the estimates for the 19 GHz input spectrum.
Current usage metrics show cumulative count of Article Views (full-text article views including HTML views, PDF and ePub downloads, according to the available data) and Abstracts Views on Vision4Press platform.
Data correspond to usage on the plateform after 2015. The current usage metrics is available 48-96 hours after online publication and is updated daily on week days.
Initial download of the metrics may take a while.