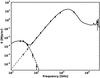
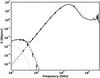
Fig.10
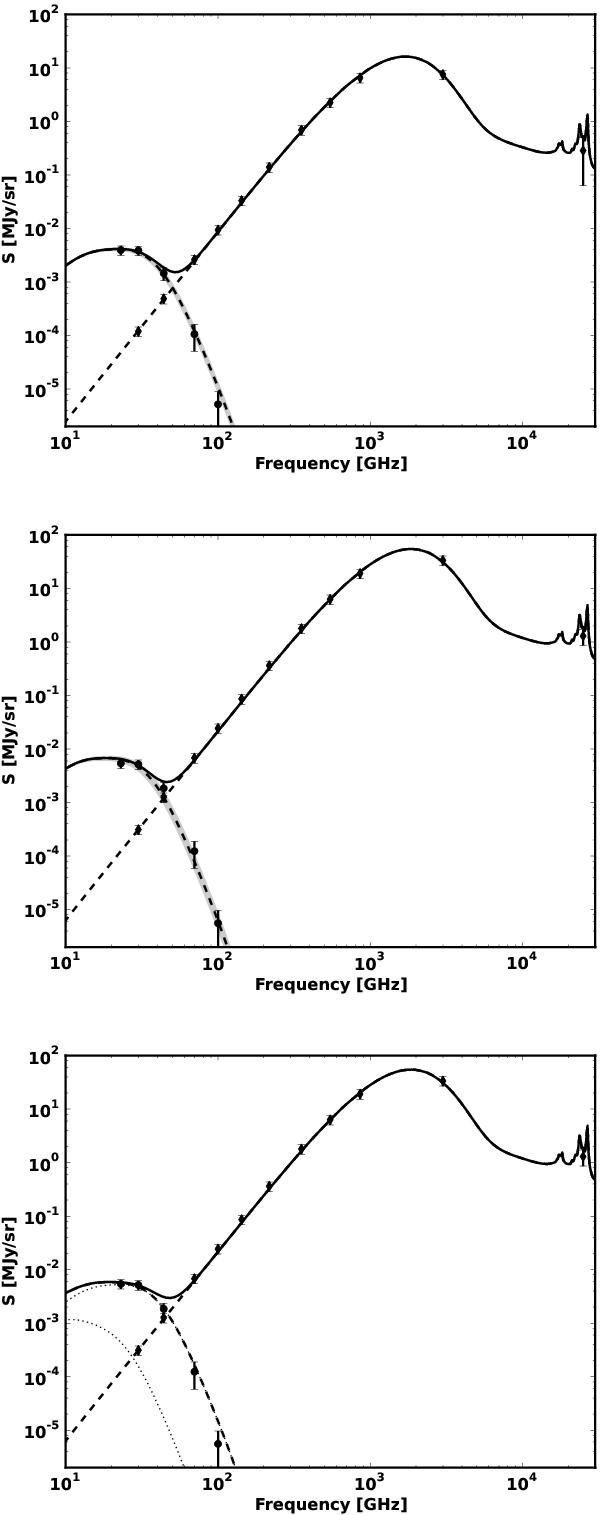
Frequency spectra (black points with error bars) for thermal dust emission and AME compared, respectively, with DustEM and SpDust (dashed lines) for the diffuse ISM (top) and ionized gas (middle and bottom) regions within the Gould Belt. The solid line is the sum of the DustEM and SpDust models. The grey area in the top and middle panels corresponds to the ± 1σ variations on the best-fit nH values when fitting for a single phase. In the bottom panel we consider a mixture of two phases (nH = 0.1cm-3 and nH = 55cm-3, in the proportion of 46% and 54%, respectively), which marginally improves the fit for the ionized gas region at 23 GHz (the error is 0.3σ instead of 0.9σ ).

Current usage metrics show cumulative count of Article Views (full-text article views including HTML views, PDF and ePub downloads, according to the available data) and Abstracts Views on Vision4Press platform.
Data correspond to usage on the plateform after 2015. The current usage metrics is available 48-96 hours after online publication and is updated daily on week days.
Initial download of the metrics may take a while.