Free Access
Fig. A.1
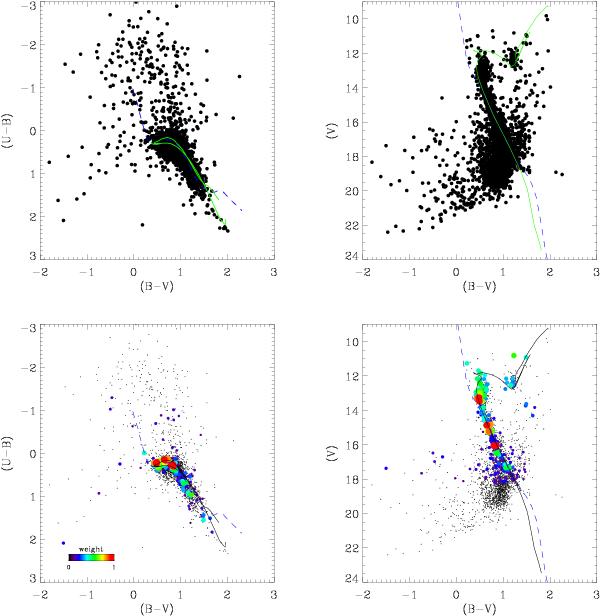
Results for the open cluster NGC 2477. Upper graphs show available UBV data and lower ones the weighted data (with symbol size and color ranging proportional to membership likelihood), the fitted isochrone (solid line) and the ZAMS (dashed line).
Current usage metrics show cumulative count of Article Views (full-text article views including HTML views, PDF and ePub downloads, according to the available data) and Abstracts Views on Vision4Press platform.
Data correspond to usage on the plateform after 2015. The current usage metrics is available 48-96 hours after online publication and is updated daily on week days.
Initial download of the metrics may take a while.