Fig. B.2
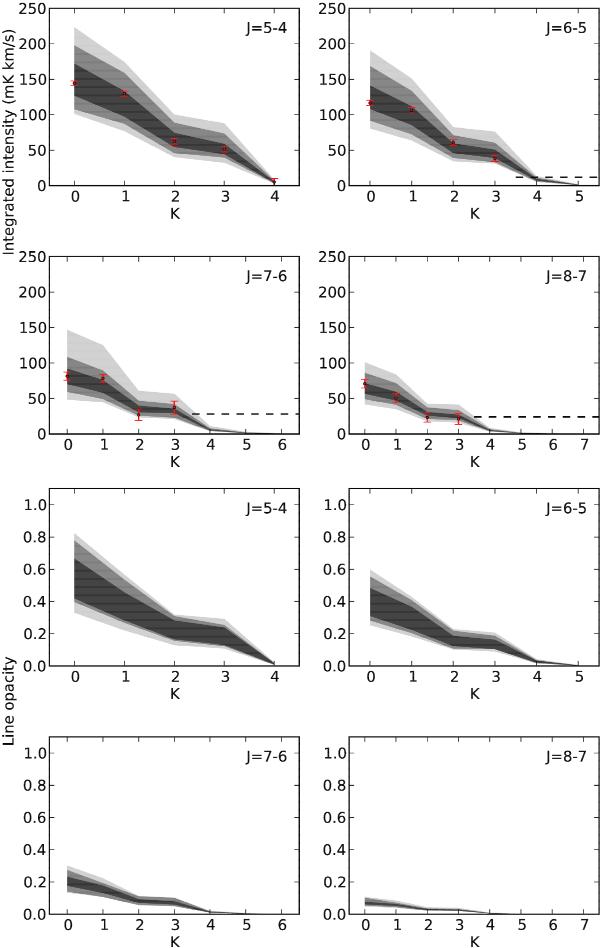
Distribution of modeled integrated intensities (top 4 panels) and line opacities (bottom 4 panels) as a function of the K number. Each panel presents the results for a different (J + 1 → J) K-ladder. The 3 different gray levels corresponds to 3 different uncertainty intervals, i.e., 68% (1σ), 95% (2σ), and 99.9% (3σ) from dark to light gray. For the 4 top panels, the observed line intensities with their 1σ uncertainty intervals are plotted as red segments The dashed horizontal black line displays the 2σ upper limits for the undetected lines.
Current usage metrics show cumulative count of Article Views (full-text article views including HTML views, PDF and ePub downloads, according to the available data) and Abstracts Views on Vision4Press platform.
Data correspond to usage on the plateform after 2015. The current usage metrics is available 48-96 hours after online publication and is updated daily on week days.
Initial download of the metrics may take a while.