Fig. B.1
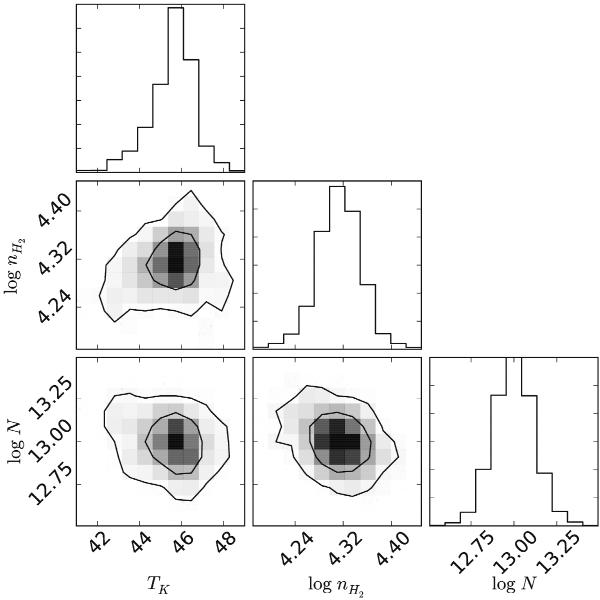
Distributions of the posterior probability for three parameters, i.e. gas density (nH2), kinetic temperature (TK) and CH3CN column density (N), at the PDR position. Along the diagonal, the one dimensional probability distribution functions are integrations of the two dimension probability distribution functions displayed below. The color coding of the two dimensional histograms runs from 0% (white) to 100% of the peak value(black). The contours correspond to 68% (1σ) and 95% (2σ) of cumulated posterior probability.
Current usage metrics show cumulative count of Article Views (full-text article views including HTML views, PDF and ePub downloads, according to the available data) and Abstracts Views on Vision4Press platform.
Data correspond to usage on the plateform after 2015. The current usage metrics is available 48-96 hours after online publication and is updated daily on week days.
Initial download of the metrics may take a while.