Fig. 7
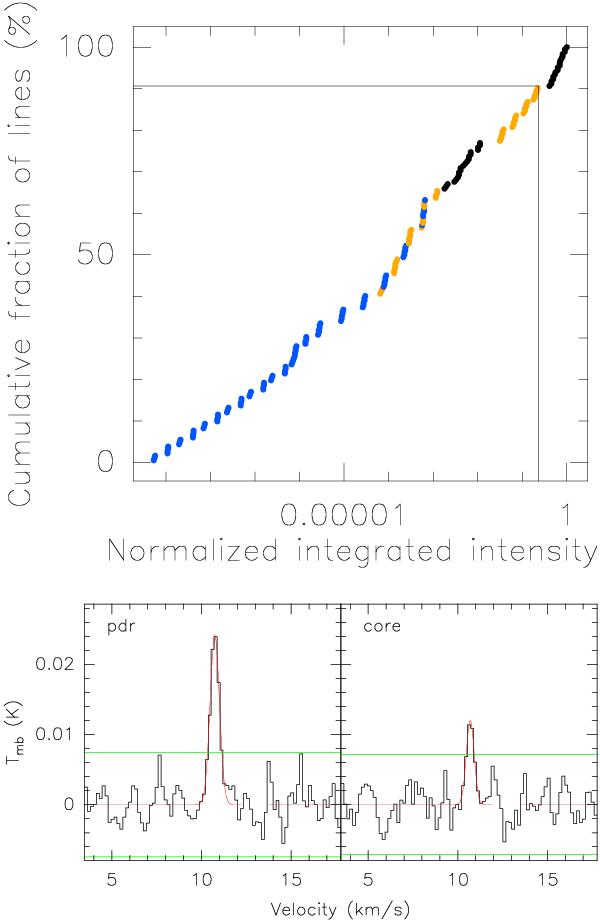
Top: cumulative distribution function of computed integrated intensities for C3N in the optically thin LTE regime with Tex = 10 K, and normalized to the intensity of the brightest line. Only 10% of all the 1, 2 and 3 mm lines have intensities brighter than a fifth of the brightest line. The transitions are color coded by bands, black: 3mm, orange: 2 mm, blue: 1 mm. Bottom C3N spectra resulting from the stacking of 38 individual lines at 3 mm. The stacked spectra are shown both for the PDR and dense core positions. The red curve is a gaussian fit to the stacked spectra, the green lines are ± 3σ levels.
Current usage metrics show cumulative count of Article Views (full-text article views including HTML views, PDF and ePub downloads, according to the available data) and Abstracts Views on Vision4Press platform.
Data correspond to usage on the plateform after 2015. The current usage metrics is available 48-96 hours after online publication and is updated daily on week days.
Initial download of the metrics may take a while.