Free Access
Fig. 6
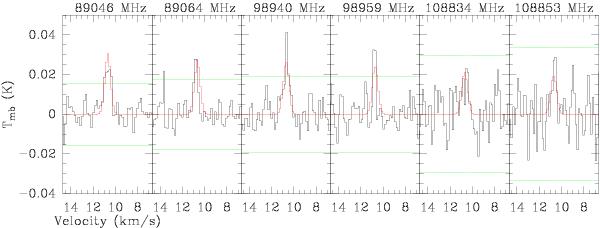
Observed spectra (black line) of the three 3 mm C3N doublets at the PDR peak. The green horizontal lines are the ± 3σ levels. The red spectrum is the LTE model for a 6′′ × 50′′ filament centered at the PDR positions, a 10 K excitation temperature, and a column density of 2 × 1012 cm-2.
Current usage metrics show cumulative count of Article Views (full-text article views including HTML views, PDF and ePub downloads, according to the available data) and Abstracts Views on Vision4Press platform.
Data correspond to usage on the plateform after 2015. The current usage metrics is available 48-96 hours after online publication and is updated daily on week days.
Initial download of the metrics may take a while.