Free Access
Fig. 5
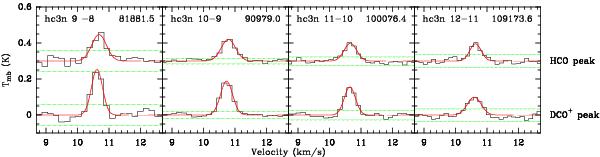
Spectrum of the HC3N 3 mm lines at the HCO peak (i.e., the PDR position, top spectrum of each panel) and the DCO+ peak (i.e., inside the cold dense core, bottom spectrum of each panel), each spectrum towards the HCO peak has been shifted vertically by 0.3 K for clarity.
Current usage metrics show cumulative count of Article Views (full-text article views including HTML views, PDF and ePub downloads, according to the available data) and Abstracts Views on Vision4Press platform.
Data correspond to usage on the plateform after 2015. The current usage metrics is available 48-96 hours after online publication and is updated daily on week days.
Initial download of the metrics may take a while.