Fig. D.2
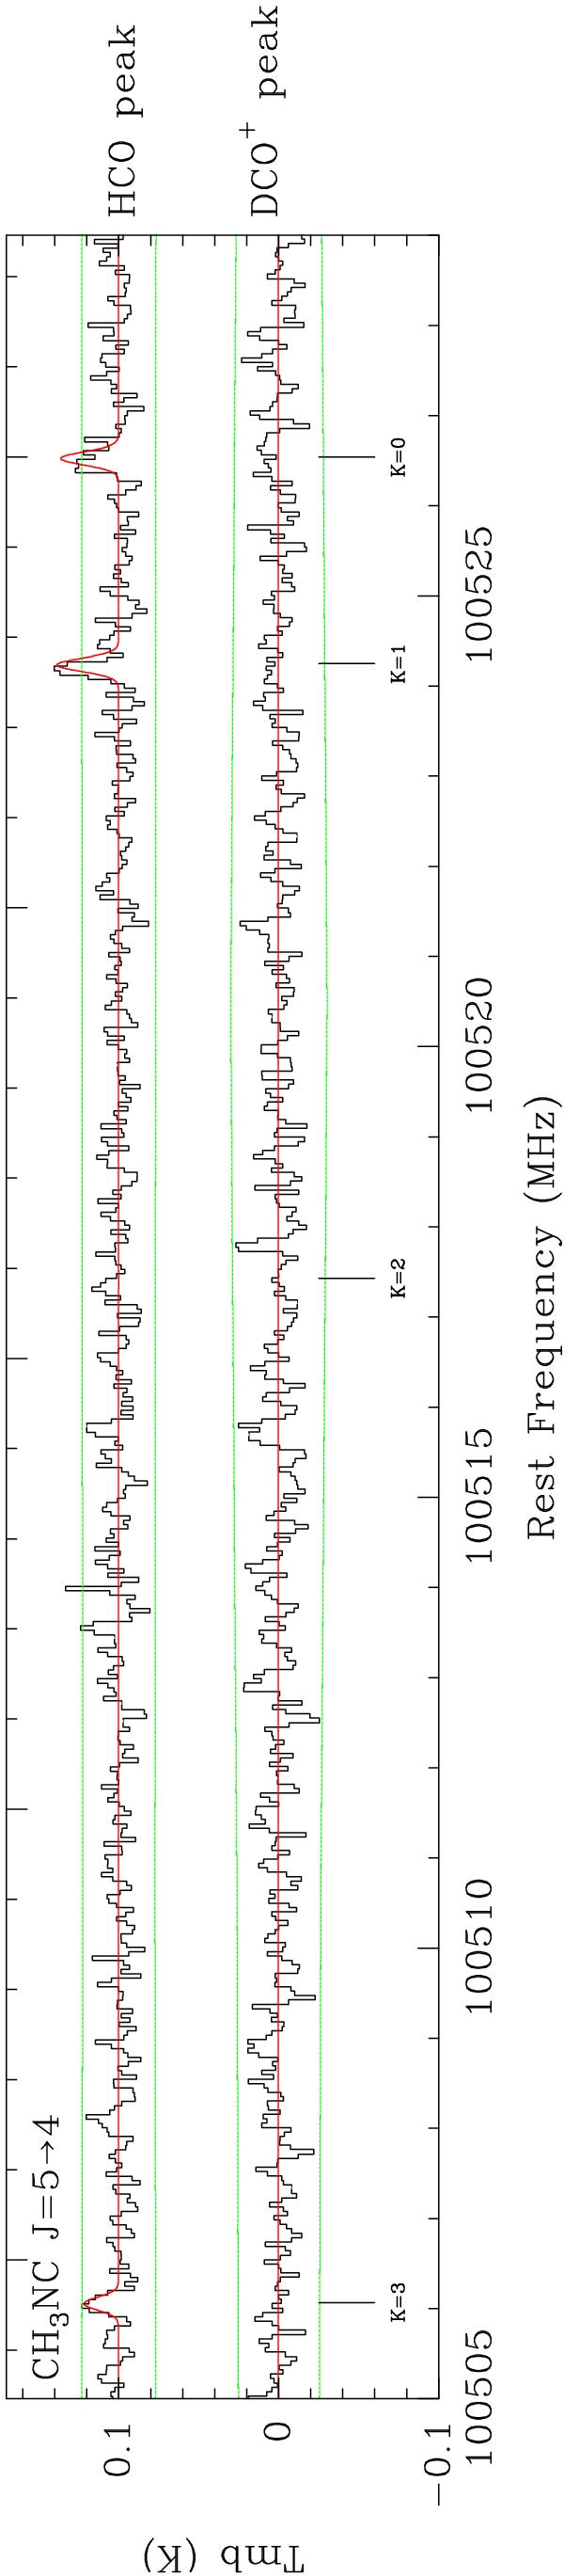
Spectrum of the CH3NC 3mm detected lines at the HCO peak (i.e., the PDR position, top spectrum) and the DCO+ peak (i.e., inside the cold dense core, bottom spectrum), the spectrum towards the HCO peak has been shifted vertically by 0.1 K for clarity. The panel displays the K set of lines for the given ΔJ set of lines. The frequencies corresponding to each transitions are displayed as vertical bars. The best fit model is overplotted in red. The green horizontal lines display the ± 3σ significance levels.
Current usage metrics show cumulative count of Article Views (full-text article views including HTML views, PDF and ePub downloads, according to the available data) and Abstracts Views on Vision4Press platform.
Data correspond to usage on the plateform after 2015. The current usage metrics is available 48-96 hours after online publication and is updated daily on week days.
Initial download of the metrics may take a while.