Fig. 1
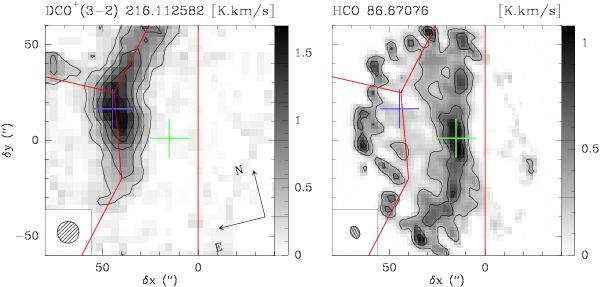
Overview of the Horsehead mane photodissociation region showing the two observed positions. Left: DCO+ map (Pety et al. 2007), right: HCO emission map (Gerin et al. 2009). In both maps, The HCO emission peak (PDR position) at RA = 05h40m53.9s, Dec = −02°28′00′′ is shown with a green cross, and the DCO+ emission peak (dense core position) at RA = 05h40m55.7s, Dec = −02°28′22′′ with a blue one. The maps have been rotated 14 degree anti clockwise around the position RA = 05h40m54.27s, Dec = −02°28′00′′ and shifted 20′′ to the east to align the PDR front (vertical red line) with the horizontal 0 offset of the map.
Current usage metrics show cumulative count of Article Views (full-text article views including HTML views, PDF and ePub downloads, according to the available data) and Abstracts Views on Vision4Press platform.
Data correspond to usage on the plateform after 2015. The current usage metrics is available 48-96 hours after online publication and is updated daily on week days.
Initial download of the metrics may take a while.