Fig. 4
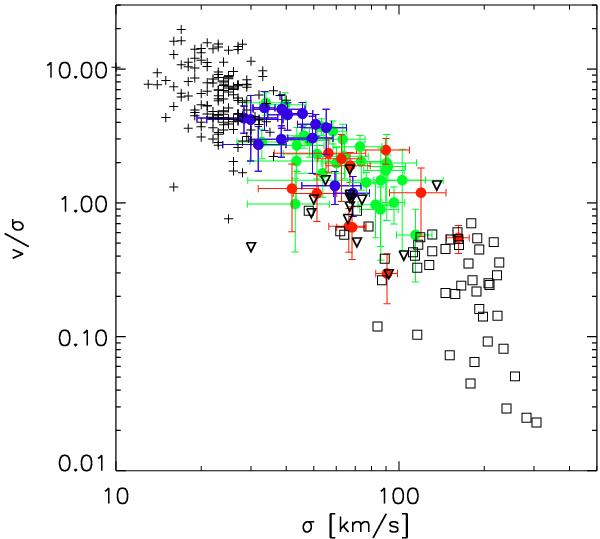
Relationship between the observed dynamical ratio v/σ, taking here the vshear/σmean (see text) and the mean velocity dispersion. Color code is the same as the one adopted in previous figures. The plus signs represent spiral GHASP galaxies (i.e., Epinat et al. 2010), empty squares E/SO objects (i.e., Cappellari et al. 2007), and top-down empty triangles LBAs (i.e., Gonçalves et al. 2010). For the spirals the v parameter is defined as the maximum amplitude of the rotational curve within the extent of the velocity field along the major axis, and σ is the average of the velocity dispersion map. For E/S0, v and σ are luminosity-weighted square quantities derived, respectively, from the velocity field and velocity dispersion maps (see details in Cappellari et al. 2007). For the LBAs, the velocity shear vshear has been defined as in this work, while the velocity dispersion is the flux-weighted mean value.
Current usage metrics show cumulative count of Article Views (full-text article views including HTML views, PDF and ePub downloads, according to the available data) and Abstracts Views on Vision4Press platform.
Data correspond to usage on the plateform after 2015. The current usage metrics is available 48-96 hours after online publication and is updated daily on week days.
Initial download of the metrics may take a while.