Fig. 2
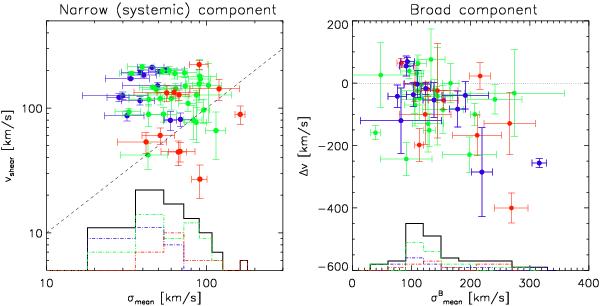
Left panel: velocity shear,
vshear, versus the mean velocity dispersion,
σmean, for the narrow (systemic) component. Blue,
green, and red dots distinguish, respectively, morphological classes 0 (isolated
disks), 1 (interacting), and 2 (mergers). The distribution of
σmean values is also shown, with the contribution of
the different morphological classes. The 1:1 dot line is shown as reference to
highlight the fact that most of the sources have
vshear > σmean.
Right panel: velocity shift, Δv, between the
broad and narrow components versus the mean velocity dispersion of the broad
component,  . The
horizontal dot line indicates the zero velocity shift. Most of the objects have a
blueshifted broad component.
. The
horizontal dot line indicates the zero velocity shift. Most of the objects have a
blueshifted broad component.
Current usage metrics show cumulative count of Article Views (full-text article views including HTML views, PDF and ePub downloads, according to the available data) and Abstracts Views on Vision4Press platform.
Data correspond to usage on the plateform after 2015. The current usage metrics is available 48-96 hours after online publication and is updated daily on week days.
Initial download of the metrics may take a while.