Fig. 1
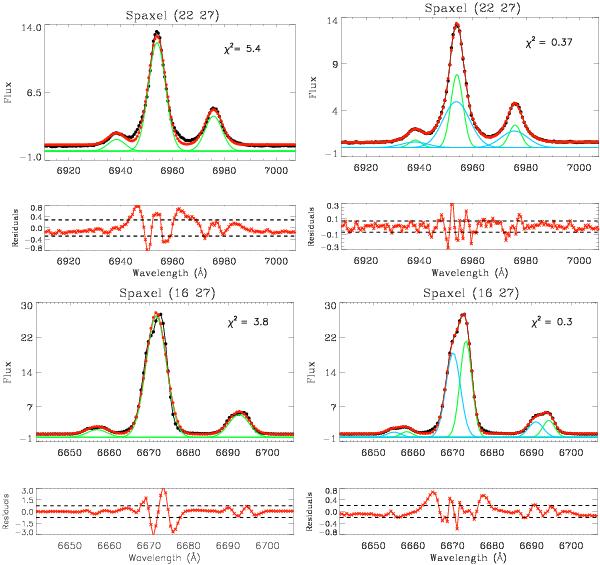
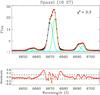
Examples of one (1c, on the left) and two (2c, on the right) component Gaussian fits to the Hα + [NII] profiles in two different spaxels in IRAS F09022-3615 (top) and IRAS F18093-5744 C (bottom). The χ2 for all the Gaussian fittings is shown for a direct comparison. The systemic (narrow) component is shown in green, while the broad one is shown in light blue. The red curve shows the total contribution coming from the Hα + [NII] Gaussian fit. Below, the residuals (i.e., data – model) are presented: they clearly show when two components are needed to properly fit asymmetric line profiles. The standard deviation value of the residuals (i.e., ±1σ) is shown using dashed lines.
Current usage metrics show cumulative count of Article Views (full-text article views including HTML views, PDF and ePub downloads, according to the available data) and Abstracts Views on Vision4Press platform.
Data correspond to usage on the plateform after 2015. The current usage metrics is available 48-96 hours after online publication and is updated daily on week days.
Initial download of the metrics may take a while.