Fig.9
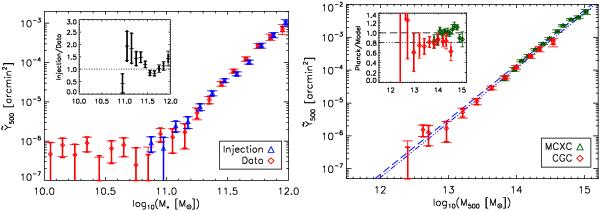
Left: comparison of the measured mean SZ signal as a function of LBG stellar mass (red points) to simulated observations (blue points). The simulations assign to each observed LBG the halo mass and positional offset of a randomly chosen simulated LBG of the same stellar mass (compare Fig. 3). Our best fit Y500-M500 scaling relation is then used, together with the universal pressure profile, to inject a simulated signal into the Planck maps (see text). An “observed” signal is obtained by applying the MMF exactly as for the real data. The inset gives the ratio of the bin-averaged injected and actual signals. Right: mean SZ signal as a function of effective halo mass. The bin-averaged SZ signal measurements of the left panel have been translated to this plane using the simulations as described in the text (the red points). The dot-dashed line is our best fit relation between halo mass and SZ signal, i.e., the one leading to the simulated measurements in the left panel. The green points give the mean SZ signal of MCXC clusters binned by a halo mass estimated from their X-ray luminosity using the REXCESS relation without correction for Malmquist bias (line 3 in Table 2 of Planck Collaboration 2011e). The dashed blue line shows the self-similar model calibrated on the REXCESS sample as given by Arnaud et al. (2010). The inset gives the ratio of all measurements to this model’s predictions. As in previous figures, the thick error bars account only for measurement uncertainties, while thin bars with large terminators result from a bootstrap analysis and so include intrinsic scatter effects.
Current usage metrics show cumulative count of Article Views (full-text article views including HTML views, PDF and ePub downloads, according to the available data) and Abstracts Views on Vision4Press platform.
Data correspond to usage on the plateform after 2015. The current usage metrics is available 48-96 hours after online publication and is updated daily on week days.
Initial download of the metrics may take a while.