Fig.5
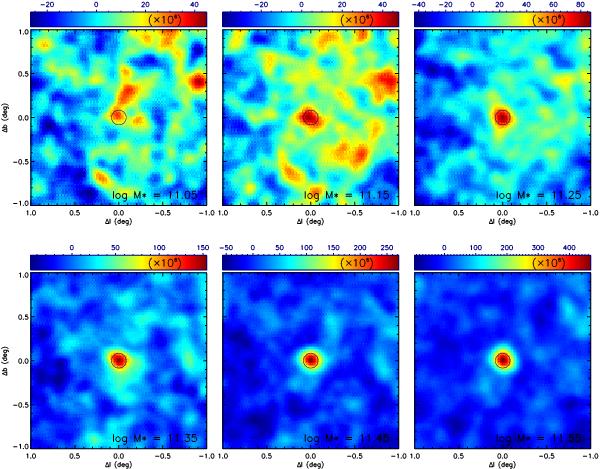
Equal-weighted stacks of reconstructed SZ maps (i.e., Comptonization parameter maps) for objects in six mass bins centred, from left to right and top to bottom, at log 10(M∗/M⊙) = [11.05,11.15,11.25,11.35,11.45,11.55] . In all cases, the bin size is taken to be 0.2, so the galaxies in two consecutive panels partially overlap. Maps are 2° on a side, with Galactic north at the top. The SZ signal traced by the central galaxies is clearly detected in all bins above log 10(M∗/M⊙) = 11.25. In all panels, the circles indicate the FWHM of the data, which corresponds to 10′.
Current usage metrics show cumulative count of Article Views (full-text article views including HTML views, PDF and ePub downloads, according to the available data) and Abstracts Views on Vision4Press platform.
Data correspond to usage on the plateform after 2015. The current usage metrics is available 48-96 hours after online publication and is updated daily on week days.
Initial download of the metrics may take a while.