Fig.4
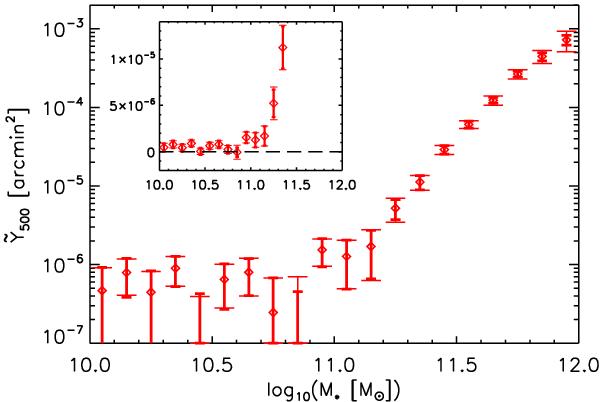
Mean SZ signal vs. stellar mass for locally brightest galaxies. Thick error bars trace the uncertainty on the bin average due purely to measurement error, while thin bars with large terminators show the variance calculated by bootstrap resampling and so also include the intrinsic scatter in the signal. The inset provides a view on a linear scale to better evaluate the significance of the detections. We observe a clear relation between the mean SZ signal and stellar mass down to log 10(M∗/M⊙) = 11.25 (the detection in this bin is at 3.5σ), with a suggestion of signal to lower mass: the next three bins show signal at 1.6σ, 1.6σ and 2.6σ, respectively.
Current usage metrics show cumulative count of Article Views (full-text article views including HTML views, PDF and ePub downloads, according to the available data) and Abstracts Views on Vision4Press platform.
Data correspond to usage on the plateform after 2015. The current usage metrics is available 48-96 hours after online publication and is updated daily on week days.
Initial download of the metrics may take a while.