Fig.3
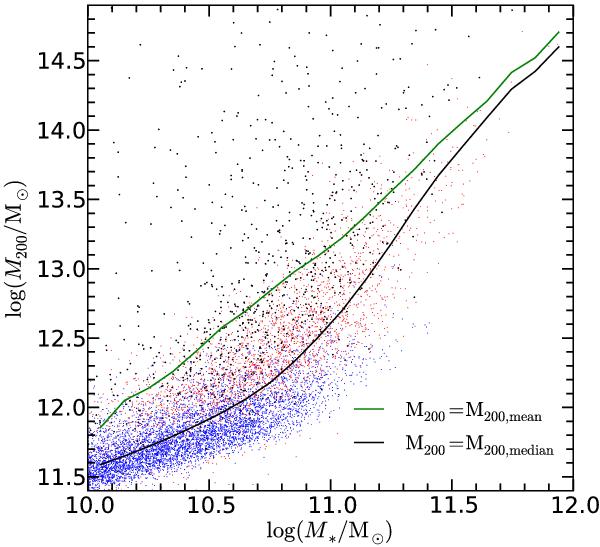
Scatter plot of M200 against M∗ for a random subset (one out of 80) of our sample of simulated locally brightest galaxies. Central galaxies are shown as red or blue points according to their g − r colour, using the cuts indicated in Fig. 1. Satellite galaxies are shown as black points. The lower and upper curves give the median and mean values of halo mass as a function of stellar mass.
Current usage metrics show cumulative count of Article Views (full-text article views including HTML views, PDF and ePub downloads, according to the available data) and Abstracts Views on Vision4Press platform.
Data correspond to usage on the plateform after 2015. The current usage metrics is available 48-96 hours after online publication and is updated daily on week days.
Initial download of the metrics may take a while.