Fig.2
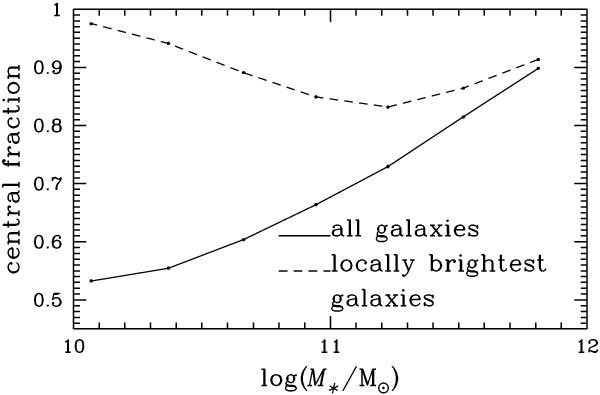
Fraction of locally brightest galaxies that are the central objects in their dark halos, based on the simulations of Guo et al. (2011). The solid line traces the fraction of all simulated galaxies that are central galaxies as a function of stellar mass. This fraction increases with stellar mass, reaching 90% at the high mass end. The dashed line presents the central galaxy fraction for locally brightest galaxies selected from the simulation according to the criteria applied to the SDSS data. This yields a sample that is over 83% reliable at all stellar masses.
Current usage metrics show cumulative count of Article Views (full-text article views including HTML views, PDF and ePub downloads, according to the available data) and Abstracts Views on Vision4Press platform.
Data correspond to usage on the plateform after 2015. The current usage metrics is available 48-96 hours after online publication and is updated daily on week days.
Initial download of the metrics may take a while.