Fig.C.4
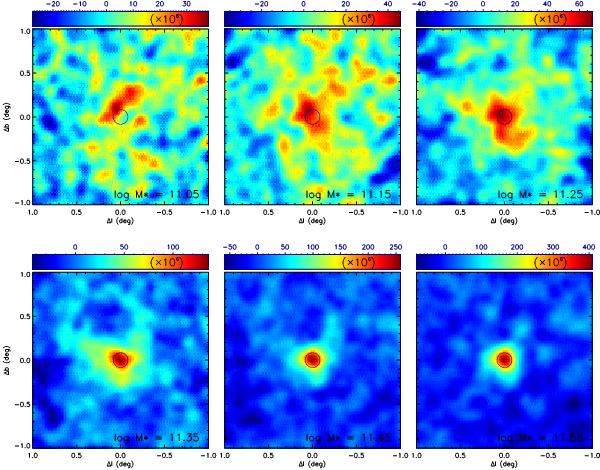
Similar to Fig. 5, but using a reconstructed SZ map that now uses all six HFI frequency channels. The noise in all maps is reduced by the inclusion of the two highest frequencies. Stacked images in the stellar-mass bins above log 10(M∗/M⊙) = 11.25 are not significantly affected, but for the low stellar-mass panels, the extended signal near map centre is larger and has higher signal to noise than in Fig. 5, suggesting that it may be real SZ signal broadened by miscentering effects.
Current usage metrics show cumulative count of Article Views (full-text article views including HTML views, PDF and ePub downloads, according to the available data) and Abstracts Views on Vision4Press platform.
Data correspond to usage on the plateform after 2015. The current usage metrics is available 48-96 hours after online publication and is updated daily on week days.
Initial download of the metrics may take a while.