Fig.1
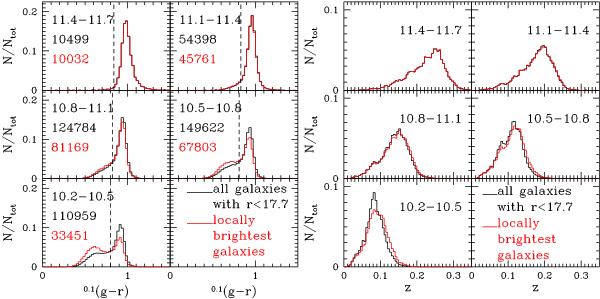
Distributions in colour (left) and redshift (right) of our locally brightest galaxies and of the SDSS/DR7 population from which they were drawn. Black histograms refer to the parent sample and red histograms to the locally brightest galaxies. The panels in each set correspond to five disjoint ranges of log 10M∗/M⊙, as indicated in the labels. In the left-hand set, additional labels give the number of galaxies contributing to the parent (black) and locally brightest (red) histograms. Dashed vertical lines in these same panels indicate the colour we use to separate red and blue galaxies in Fig. 3 below.
Current usage metrics show cumulative count of Article Views (full-text article views including HTML views, PDF and ePub downloads, according to the available data) and Abstracts Views on Vision4Press platform.
Data correspond to usage on the plateform after 2015. The current usage metrics is available 48-96 hours after online publication and is updated daily on week days.
Initial download of the metrics may take a while.