Fig. 1
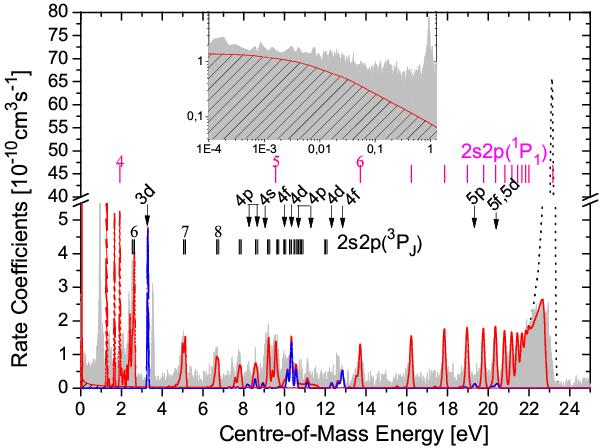
Recombination rate coefficients for Be-like F recombining into B-like F. The grey area represents the experimentally derived recombination rate coefficients. The red solid curve shows calculated ground-state recombination rate coefficients (DR +TR), and the blue solid curve (and corresponding white area) shows calculated TR rate coefficients, both scaled to 85%, as discussed in the text to account for the metastable fraction of the ion beam present in the experiment. The black dotted line is the calculated field-ionization-free rate coefficients, scaled to 85%. The RR contribution to the experimental spectrum is shown by the hatched area in the inset. The vertical bars show the approximate DR resonance positions calculated with Eq. (2). Vertical arrows show TR resonance positions and their configurations obtained from the AUTOSTRUCTURE calculations.
Current usage metrics show cumulative count of Article Views (full-text article views including HTML views, PDF and ePub downloads, according to the available data) and Abstracts Views on Vision4Press platform.
Data correspond to usage on the plateform after 2015. The current usage metrics is available 48-96 hours after online publication and is updated daily on week days.
Initial download of the metrics may take a while.