Fig. 9
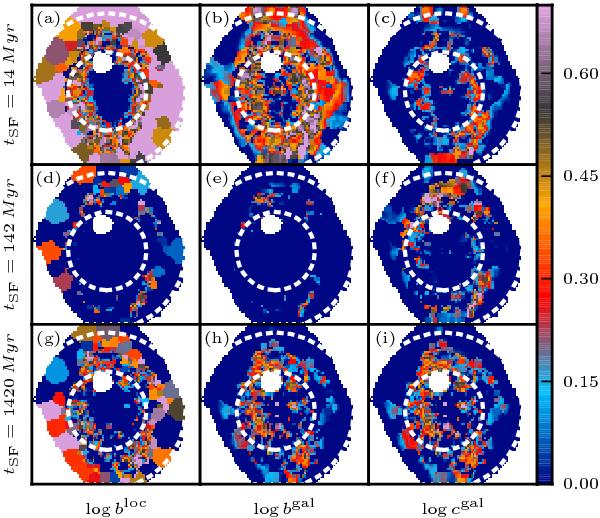
Spatially resolved SFR surface density (Eq. (11)) on the last tSF = 14
(top), 142 (middle), and 1420
(bottom) Myr in units of different reference values. The
left panels compare  to
to
 , i.e., the all-times
average at xy, thus providing a local version of Scalo’s
b parameter (Eq. (12)). Middle panels compare the local
, i.e., the all-times
average at xy, thus providing a local version of Scalo’s
b parameter (Eq. (12)). Middle panels compare the local
 to the all-times average over the whole galaxy (Eq. (13)). Panels on the right compare
to that of the galaxy as a whole over the same time scale (Eq.
(14)). All images are on log scale
from log 1 to log 5, such that only values above the
corresponding reference value are visible.
to the all-times average over the whole galaxy (Eq. (13)). Panels on the right compare
to that of the galaxy as a whole over the same time scale (Eq.
(14)). All images are on log scale
from log 1 to log 5, such that only values above the
corresponding reference value are visible.
Current usage metrics show cumulative count of Article Views (full-text article views including HTML views, PDF and ePub downloads, according to the available data) and Abstracts Views on Vision4Press platform.
Data correspond to usage on the plateform after 2015. The current usage metrics is available 48-96 hours after online publication and is updated daily on week days.
Initial download of the metrics may take a while.