Fig. 2
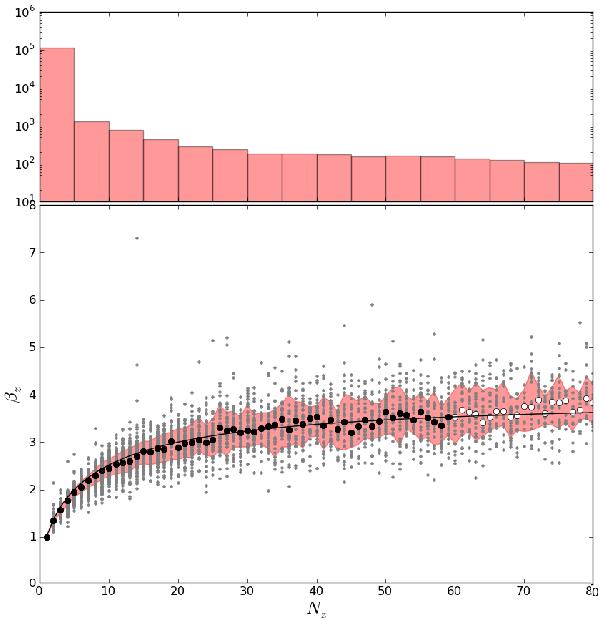
Ratio of the measured over the idealized noise for Voronoi zones comprising Nz spaxels. The idealized noise is that derived under the assumption of uncorrelated errors, while the measured one is obtained from the detrended standard deviation of fluxes in a ± 45 Å range around 5635 Å. Gray dots represent βz values for 99267 spaxels from 109 galaxies. Circles show the median βz for each Nz, and the solid line shows Eq. (4). The top panel shows the histogram of Nz values (notice the logarithmic scale).
Current usage metrics show cumulative count of Article Views (full-text article views including HTML views, PDF and ePub downloads, according to the available data) and Abstracts Views on Vision4Press platform.
Data correspond to usage on the plateform after 2015. The current usage metrics is available 48-96 hours after online publication and is updated daily on week days.
Initial download of the metrics may take a while.