Fig. 12
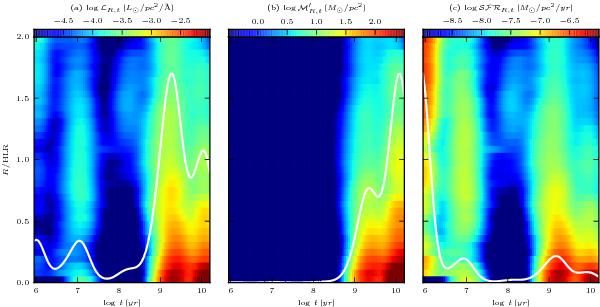
R–t diagrams showing the radially averaged
distribution of light, mass, and SFR as a function distance from the nucleus and
age. Left: luminosity at λ = 5635 Å per unit area.
(ℒR,t). Middle: stellar mass formed
per unit area  . Right:
time-dependent SFR per unit area
. Right:
time-dependent SFR per unit area  .
The solid (white) lines represent the sum over all spaxels for a given age.
.
The solid (white) lines represent the sum over all spaxels for a given age.
Current usage metrics show cumulative count of Article Views (full-text article views including HTML views, PDF and ePub downloads, according to the available data) and Abstracts Views on Vision4Press platform.
Data correspond to usage on the plateform after 2015. The current usage metrics is available 48-96 hours after online publication and is updated daily on week days.
Initial download of the metrics may take a while.