Fig. 11
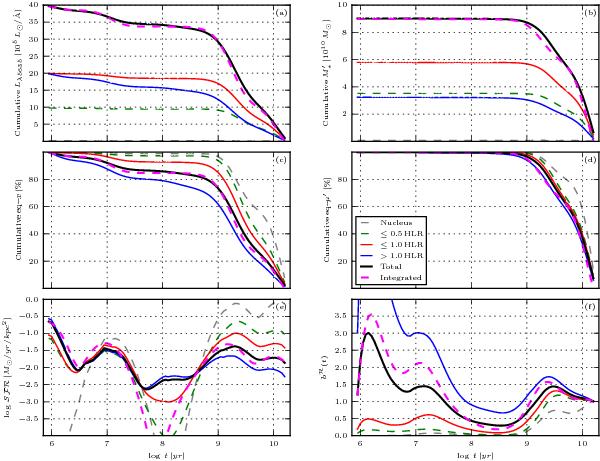
Time evolution of light and mass representations of the SFH, as derived from the
starlight fits. The discrete
xtZxy and
 population vectors involved in these curves were smoothed in log t,
marginalized in Z, and integrated over the spatial regions
indicated. Dotted grey lines indicate the nucleus (central pixel). Green, red, and
blue lines correspond to R ≤ 0.5 HLR, R ≤ 1 HLR,
and R > 1 HLR regions, respectively. The
black line represents the whole galaxy evolution as reconstructed from the sum of
its parts, while (as in Fig. 10) the magenta
dashed line is used to represent the results obtained for the spatially integrated
spectrum.
population vectors involved in these curves were smoothed in log t,
marginalized in Z, and integrated over the spatial regions
indicated. Dotted grey lines indicate the nucleus (central pixel). Green, red, and
blue lines correspond to R ≤ 0.5 HLR, R ≤ 1 HLR,
and R > 1 HLR regions, respectively. The
black line represents the whole galaxy evolution as reconstructed from the sum of
its parts, while (as in Fig. 10) the magenta
dashed line is used to represent the results obtained for the spatially integrated
spectrum.
Current usage metrics show cumulative count of Article Views (full-text article views including HTML views, PDF and ePub downloads, according to the available data) and Abstracts Views on Vision4Press platform.
Data correspond to usage on the plateform after 2015. The current usage metrics is available 48-96 hours after online publication and is updated daily on week days.
Initial download of the metrics may take a while.