Fig. 10
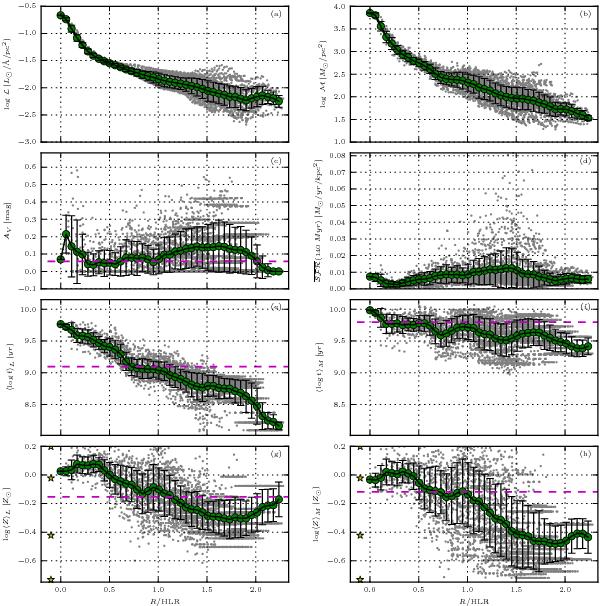
Radial profiles of several properties. Grey points correspond to values in individual xy spaxels. The green circles and solid lines represent the average of the plotted quantity, while the error bars represent the dispersion in the R-bin. The dashed magenta horizontal line (only in the plots not involving surface densities) marks the value derived from the starlight analysis of the integrated spectrum, i.e., collapsing the xy dimensions of the datacube. The stars in the bottom panels mark the four metallicities in the base models.
Current usage metrics show cumulative count of Article Views (full-text article views including HTML views, PDF and ePub downloads, according to the available data) and Abstracts Views on Vision4Press platform.
Data correspond to usage on the plateform after 2015. The current usage metrics is available 48-96 hours after online publication and is updated daily on week days.
Initial download of the metrics may take a while.