Fig. 2
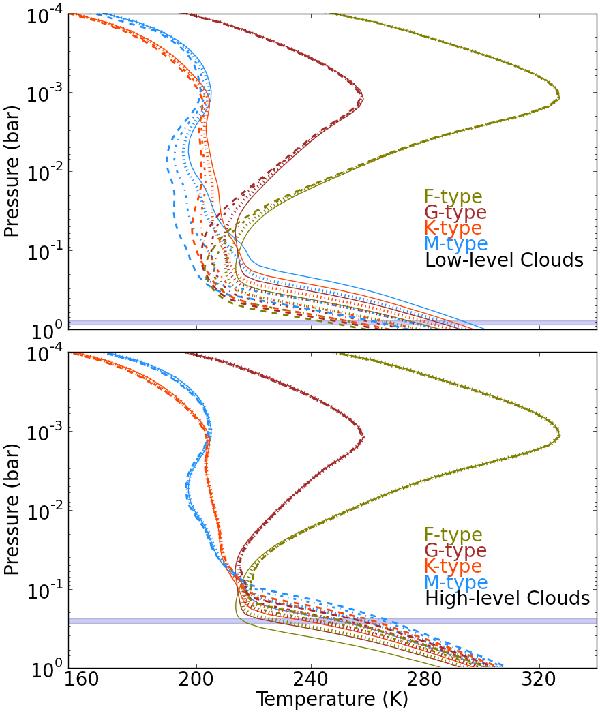
Pressure–temperature profiles influenced by low and high clouds for four different coverages (Kitzmann et al. 2010): 0% (solid lines), 30% (dotted), 70% (dash-dot), and 100% (dashed). Planets are modeled around typical F (olive green), G (brown), K (orange), and M (blue) star types. The location of the low- (top) and high-level (bottom) clouds is also illustrated.
Current usage metrics show cumulative count of Article Views (full-text article views including HTML views, PDF and ePub downloads, according to the available data) and Abstracts Views on Vision4Press platform.
Data correspond to usage on the plateform after 2015. The current usage metrics is available 48-96 hours after online publication and is updated daily on week days.
Initial download of the metrics may take a while.