Open Access
Fig. 16
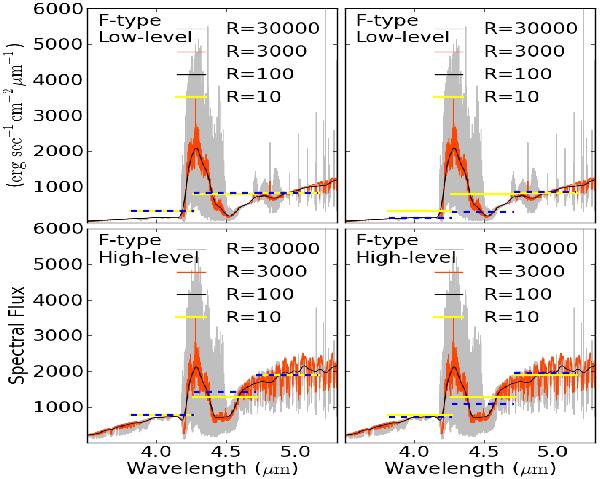
Spectra showing the N2O band at 4.5 μm influenced by 100% low (top) and high-level (bottom) cloud coverages. The figure on the left shows an atmosphere with (yellow) and without (blue) the presence of N2O and the one on the right, an atmosphere with and without CO2 for resolution 10.
Current usage metrics show cumulative count of Article Views (full-text article views including HTML views, PDF and ePub downloads, according to the available data) and Abstracts Views on Vision4Press platform.
Data correspond to usage on the plateform after 2015. The current usage metrics is available 48-96 hours after online publication and is updated daily on week days.
Initial download of the metrics may take a while.