Fig. 6
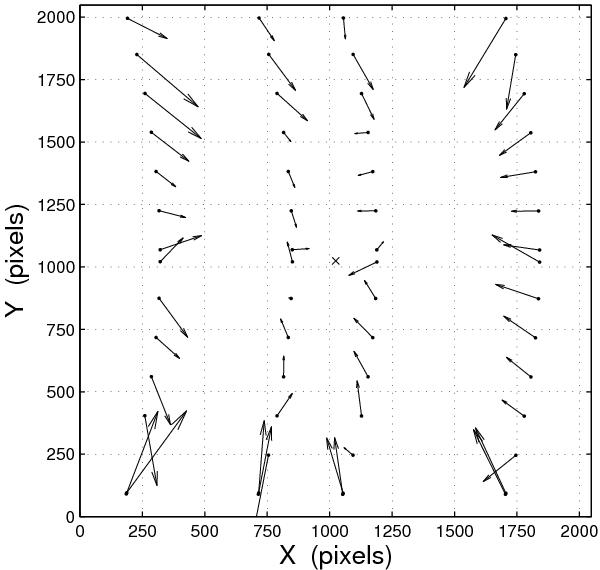
Measured shifts in the locations of 60 ThAr spots from a flood-lamp exposure and from one of the science frames taken during the same night, illustrating a severe case of flexure. The shifts are indicated by arrows, calculated after the mean shift (ΔX = 0.21 and ΔY = 0.46 pixels) has been subtracted; the arrows have been magnified 1000 times for illustration purposes. The change in scale is clearly visible.
Current usage metrics show cumulative count of Article Views (full-text article views including HTML views, PDF and ePub downloads, according to the available data) and Abstracts Views on Vision4Press platform.
Data correspond to usage on the plateform after 2015. The current usage metrics is available 48-96 hours after online publication and is updated daily on week days.
Initial download of the metrics may take a while.